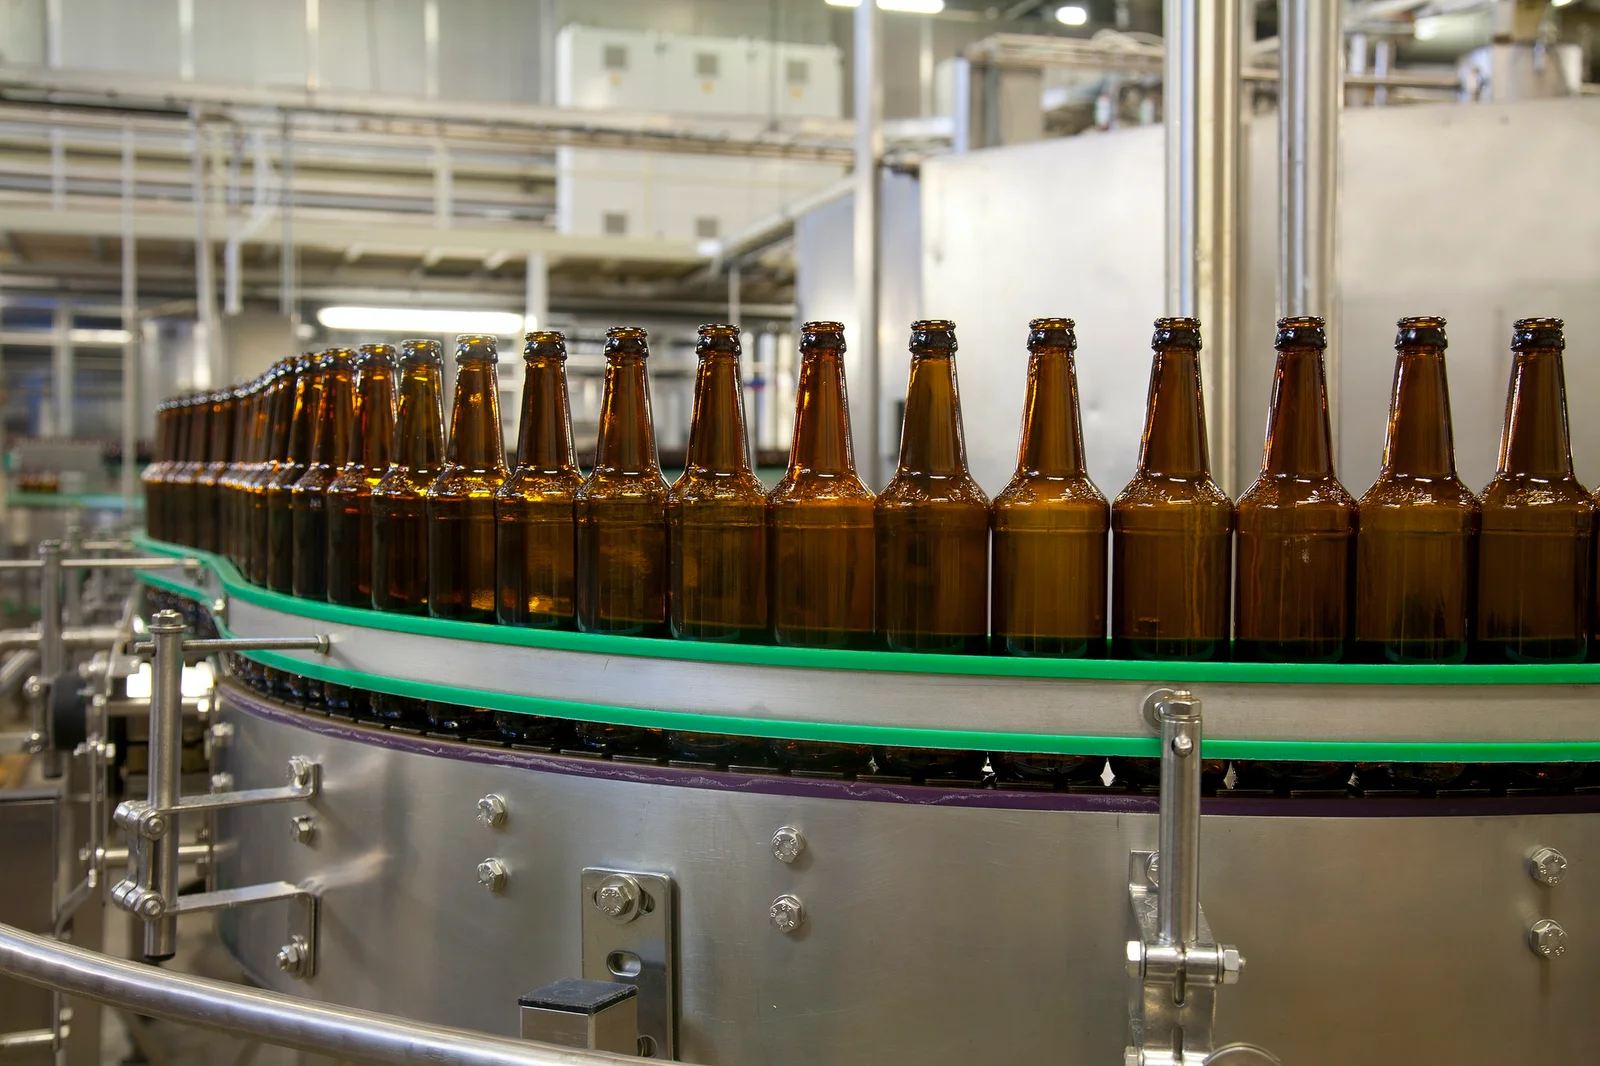
Craft beer equipment helps a brewery grow by increasing output without requiring the same percentage increase in labor, floor space, water, or production time. A 10 BBL brewhouse produces about 310 gallons per turn, while a 30 BBL system produces about 930 gallons. Tank sizing, glycol cooling, CIP, automated controls, and faster packaging determine whether that extra wort becomes saleable beer. In 2025, U.S. craft breweries produced about 22.0 million barrels, down 4% from 2024, while 60% of surveyed breweries reported lower production. In a tighter market, equipment has to improve utilization and cost per barrel, not simply add capacity.
Production usually reaches its first limit in the brewhouse. Moving from a 5 BBL system to a 20 BBL system raises nominal batch volume from 155 to 620 U.S. gallons because one U.S. beer barrel equals 31 gallons. A brewery making two 5 BBL turns per day would need four similar turns to produce 20 BBL; a properly sized 20 BBL brewhouse can make the same wort volume in one turn, although heating, lautering, boiling, whirlpool, transfer, and cleaning times still vary by recipe and equipment design.
The brewhouse cannot be considered alone because fermentation occupies equipment much longer than wort production. A brewhouse may finish a turn in several hours, while an ale may remain in a fermenter for roughly 10–21 days depending on yeast, gravity, temperature, dry hopping, conditioning, and the brewery’s quality targets. Four 20 BBL turns per week therefore create 80 BBL of new cellar demand every seven days, so fermentation capacity can become the limiting stage even when the brewhouse is idle for part of the week.
Tank ratios provide a simple way to see the issue:
| Production setup | Nominal volume |
|---|---|
| 10 BBL brewhouse, 1 turn | 310 gal |
| 20 BBL brewhouse, 1 turn | 620 gal |
| 20 BBL brewhouse, 2 turns | 1,240 gal |
| 40 BBL fermenter | 1,240 gal |
| 4 × 40 BBL fermenters | 4,960 gal |
Using 40 BBL fermenters with a 20 BBL brewhouse allows two turns to feed one tank when the recipe, yeast plan, oxygenation, and production schedule permit it. That arrangement can reduce the number of tanks needed for high-volume beers, while smaller 10 or 20 BBL vessels remain useful for seasonal releases that do not justify 40 BBL batches.
Vessel capacity should be planned from tank occupancy days and weekly packaged volume, not from brewhouse size alone.
Cooling capacity comes next because larger fermenters release more fermentation heat and contain more beer that must be brought down to conditioning temperature. Glycol chillers, jacket surface area, pump sizing, supply temperature, pipe insulation, and simultaneous tank demand all affect cooling performance. A chiller sized for four tanks may struggle after the cellar grows to 10 or 12 vessels, especially when several tanks are cold-crashed during the same production period.
Utilities become more visible as volume rises. Brewers Association guidance reports typical brewery electrical use around 12–22 kWh per barrel and thermal use around 1.3–1.5 therms per barrel, although actual consumption varies widely with brewery size, refrigeration, packaging, building design, heating method, and operating schedule. Its benchmarking work also found that energy use per barrel generally falls as annual production increases because fixed energy requirements are spread across more packaged beer.
Water follows the same production chain. Brewers Association water guidance cites an average brewery water-to-beer ratio of roughly 7:1, while some craft breweries have operated below 3:1. A plant making 10,000 barrels a year at a 7:1 ratio uses about 70,000 barrels of water, equivalent to roughly 2.17 million U.S. gallons. Cutting the ratio to 4:1 would reduce annual use to about 1.24 million gallons, before differences in local wastewater charges are considered.
Cleaning equipment influences that ratio because tanks, hoses, heat exchangers, transfer lines, and packaging equipment are cleaned repeatedly. A CIP skid can control circulation time, temperature, chemical concentration, and recovery more consistently than unrestricted hose cleaning. Larger breweries may separate caustic, rinse water, acid, and sanitizer steps so reusable solutions are not discharged after a single circulation.
The labor effect becomes easier to measure once cleaning, transfers, and valves are included. A brewer operating manual valves may walk between the brewhouse, cellar, pumps, and utility area several times during one turn. PLC-controlled pumps, temperature loops, recipe steps, and automated valves can reduce repetitive handling while keeping operators involved in sampling, sensory checks, yeast management, maintenance, and release decisions.
Automation also records operating data. A 2026 brewery expanding from one shift to two can give both crews the same mash-rest temperatures, pump settings, transfer sequences, fermentation setpoints, and alarm limits rather than relying on verbal instructions. Recorded batch data also make deviations easier to review when attenuation, yield, cooling time, or package quality changes.
Automation is most useful when it removes repeated manual steps and produces records that operators can compare from batch to batch.
Packaging deserves the same capacity planning. A cellar producing 40 BBL of finished beer cannot run efficiently if the packaging line requires most of a working day to clear one tank. For reference, 40 BBL equals 1,240 gallons, or roughly 13,227 twelve-ounce fills before normal losses, foam, startup waste, and quality rejects are considered.
Fill speed is only one measurement. Oxygen pickup can shorten package life even when throughput is high. Brewers Association guidance for mobile canning recommends package dissolved oxygen below 50 ppb as a quality target and advises checking total package oxygen at the beginning of every packaging run. Seam inspection and package-weight checks are also part of the recommended process.
That relationship explains why adding a faster canning line can release capacity elsewhere. Beer that leaves a bright tank sooner frees that vessel for another batch; freeing the bright tank can let another fermenter transfer; freeing the fermenter creates space for the next brewhouse turn. Packaging capacity therefore affects the practical utilization rate of equipment upstream.
The same reasoning applies to malt handling. A larger mash vessel gives limited benefit when operators still lift every 55 lb bag manually, the mill feeds slowly, or the grist case holds less than one full batch. Augers, conveyors, grist cases, load cells, and larger mills can reduce grain-transfer time while keeping mash-in rates consistent. A 20 BBL recipe using 1,000–1,500 lb of malt involves roughly 18–27 bags if supplied in 55 lb sacks, depending on recipe gravity and brewhouse efficiency.
Brewhouse efficiency affects ingredient purchasing as well. Brewers Association material published in 2026 notes that a 10% improvement in extract efficiency can represent roughly one fewer bag of malt per batch in an example brewing operation. The exact saving changes with malt price, recipe, original gravity, batch volume, and starting efficiency, so breweries normally compare extract yield and grain cost over many batches rather than using one recipe as the benchmark.
Physical expansion has another set of limits. Installing six additional fermenters may require more glycol capacity, electrical service, floor drainage, CO₂ distribution, compressed air, hot water, wastewater handling, and ceiling clearance. A brewery that reserves utility connections and floor positions during its first build can add tanks with less demolition than a plant where every pipe and panel was sized only for opening-day production.
For breweries planning several beverage categories, equipment suppliers may package brewhouse, cellar, utilities, cleaning, controls, and processing support under a Brewery/Distillery/Winery All-In-One Solution. The useful comparison is still technical: vessel working volume, material specification, weld finish, pressure rating, cooling area, pump curves, control architecture, utility demand, spare-parts access, installation scope, commissioning, and expansion compatibility should be written into the equipment specification before purchase.
Market conditions make that discipline more important. The Brewers Association reported 9,578 U.S. craft breweries in 2025, down 2.9% from 9,796 in 2024. Craft production fell 4% to 22.034 million barrels, while the wider U.S. beer category declined 5.7% by volume. Microbreweries recorded an 8.9% production decline, while 35% of microbreweries still reported some growth.
A brewery expanding in that environment has more reason to calculate utilization before ordering capacity. A 30 BBL brewhouse running at 30% of available production time ties up more capital than a smaller system running closer to its planned schedule. Tank turns per year, packaged barrels per labor hour, water per barrel, kWh per barrel, brewhouse yield, package loss, cellar occupancy, and downtime provide a clearer view of whether installed equipment is being used productively.
Equipment choice can then be tied to an actual production plan. A brewery expecting 6,000 BBL in annual sales, for example, can work backward from weekly package demand, fermentation residence time, anticipated loss percentages, number of brewing weeks, and planned turns per day. The resulting model shows whether the next purchase should be another fermenter, a larger chiller, a CIP skid, more bright-beer capacity, a faster packaging line, or a larger brewhouse rather than assuming that the biggest vessel will improve the whole plant.